
Measured · No. 1 · 2026-10-24
The Banner Is Not the Script
364,048 on-screen banners, 57% of them impossible to check against the audio, and among the rest only 6.2% mostly spoken. The lower third is a second editorial layer, not a caption.
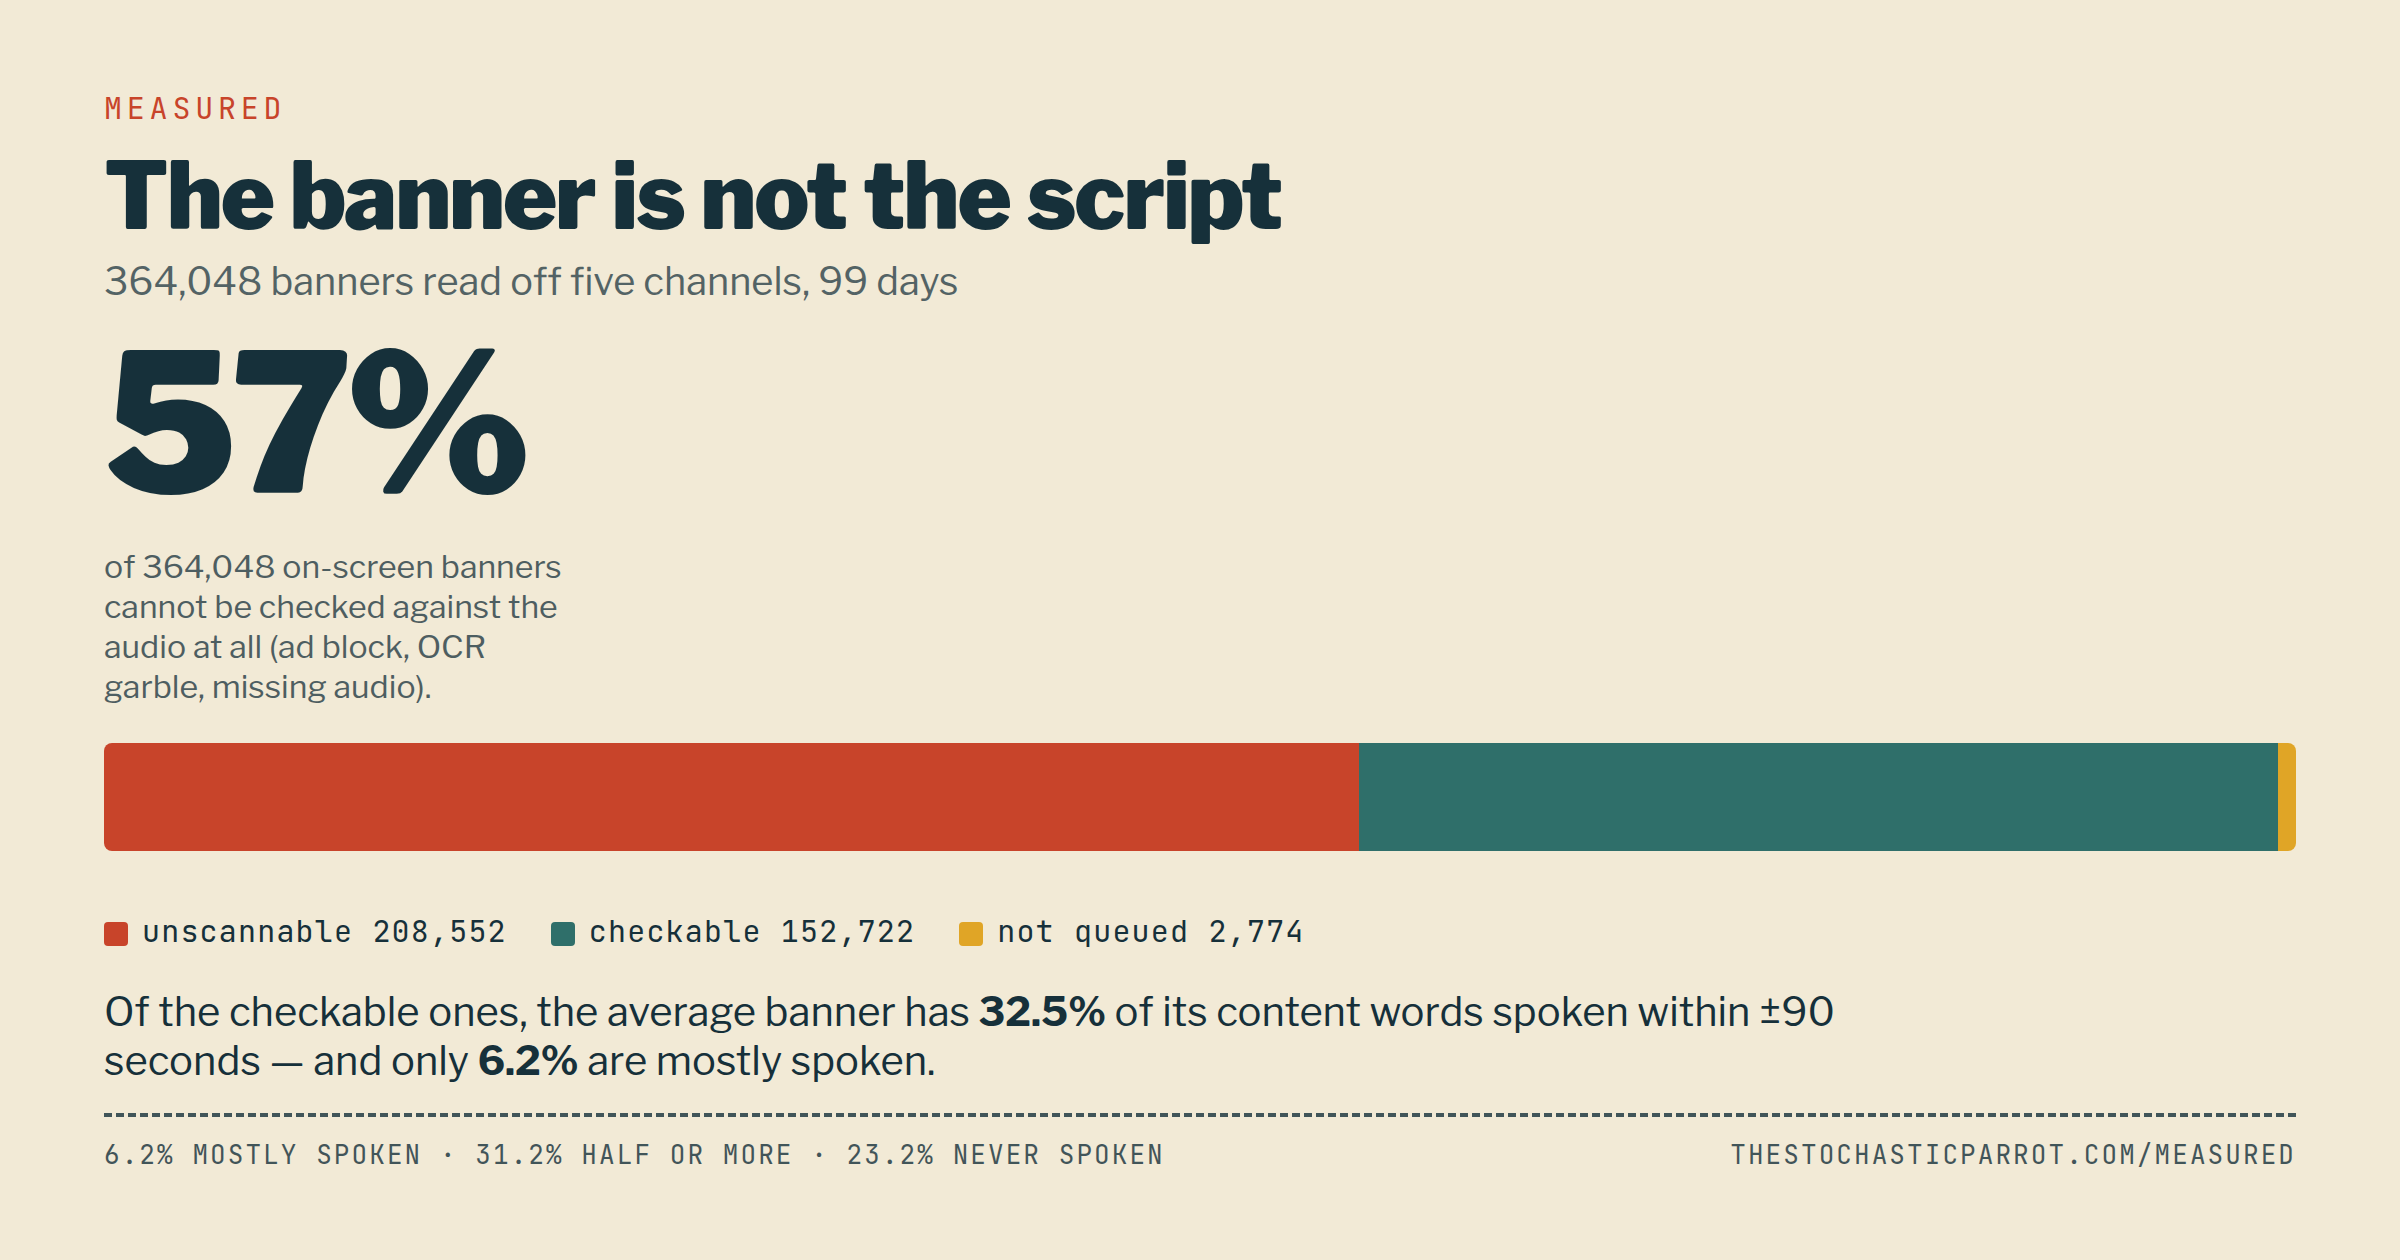
I recorded four cable channels and one public-affairs feed for ninety-nine days. Then I read the banners off the screen. There are 364,048 of them in the record, and the first thing they tell you is that the banner and the script are two different documents.
Of those 364,048 on-screen banners, 208,552 — 57% — cannot be fairly checked against the audio at all. The desk marks them unscannable: they aired over a commercial, the OCR came back as rubble, or there is no audio for that window. That number is not a complaint about the data. It is the price of measuring television from outside the control room, and it is stated here before any finding that depends on it.
The 152,722 banners that can be checked, checked this way: take the banner's content words, then ask whether each of them appears in that channel's own speech within ninety seconds either side. The result is not close to one.
- The average banner has 32.5% of its content words spoken nearby. - 23.2% of scorable banners have none of them spoken at all. - Only 31.2% have half or more of their words spoken. - Only 6.2% are mostly spoken — 80% or more.
So the chyron is not a caption. It is a separate editorial layer, written to be read while the anchor says something else, and it diverges from the audio most of the time. Anyone who has ever felt that the lower third was telling a slightly different story than the man reading the prompter has the receipt now: 93.8% of the time the banner is not substantially spoken.
The unscannable share is not distributed evenly. MSNOW's banners are unscannable 68.7% of the time, against BBC 56.0%, Fox News 52.7% and CNN 51.6%. Some of that is OCR quality on dense layouts, some is ad load, some is set design. The desk does not know which yet, and says so rather than picking the flattering explanation.
What this does not say. It does not say anyone lied. A banner that summarises rather than quotes is doing its job; a banner that editorialises is doing a different job. The desk records the divergence, not the motive. It also does not claim the 93.8% figure is a rate of deception — it is a rate of difference between two surfaces the same channel produced at the same moment, which is the only thing the collection can measure.
Method. Source: data/observatory/observatory.db, table chyrons (364,048 rows, 97,144 CNN / 91,679 MSNOW / 91,677 BBC / 83,548 Fox News), window 2026-07-15 to 2026-10-23, recording stopped 2026-10-23. spoken_cov = fraction of banner content-terms found in the channel's utterances within ±90 seconds; the sentinel -1.0 marks unscannable banners (ad block, OCR noise, missing audio) and NULL marks rows not yet queued (2,774). Figures pinned in data/measured/facts.json, every number carrying its query. Rerun with python -m parrot.measured.
How to check every number. Figures are generated by
python -m parrot.measured into data/measured/facts.json, each one
carrying the query that produced it. The recording window closed on 2026-10-23; the desk does
not add to it. Corrections are published against the facts file, not edited into the prose.