
Measured · No. 4 · 2026-10-27
Banners Per Hour of Editorial Time
116 banners an hour of story airtime on CNN, 73 on MSNOW — and all four channels within 49-58 per hour of whatever aired. The rate is a cutting-rhythm artefact, not an editorial appetite.
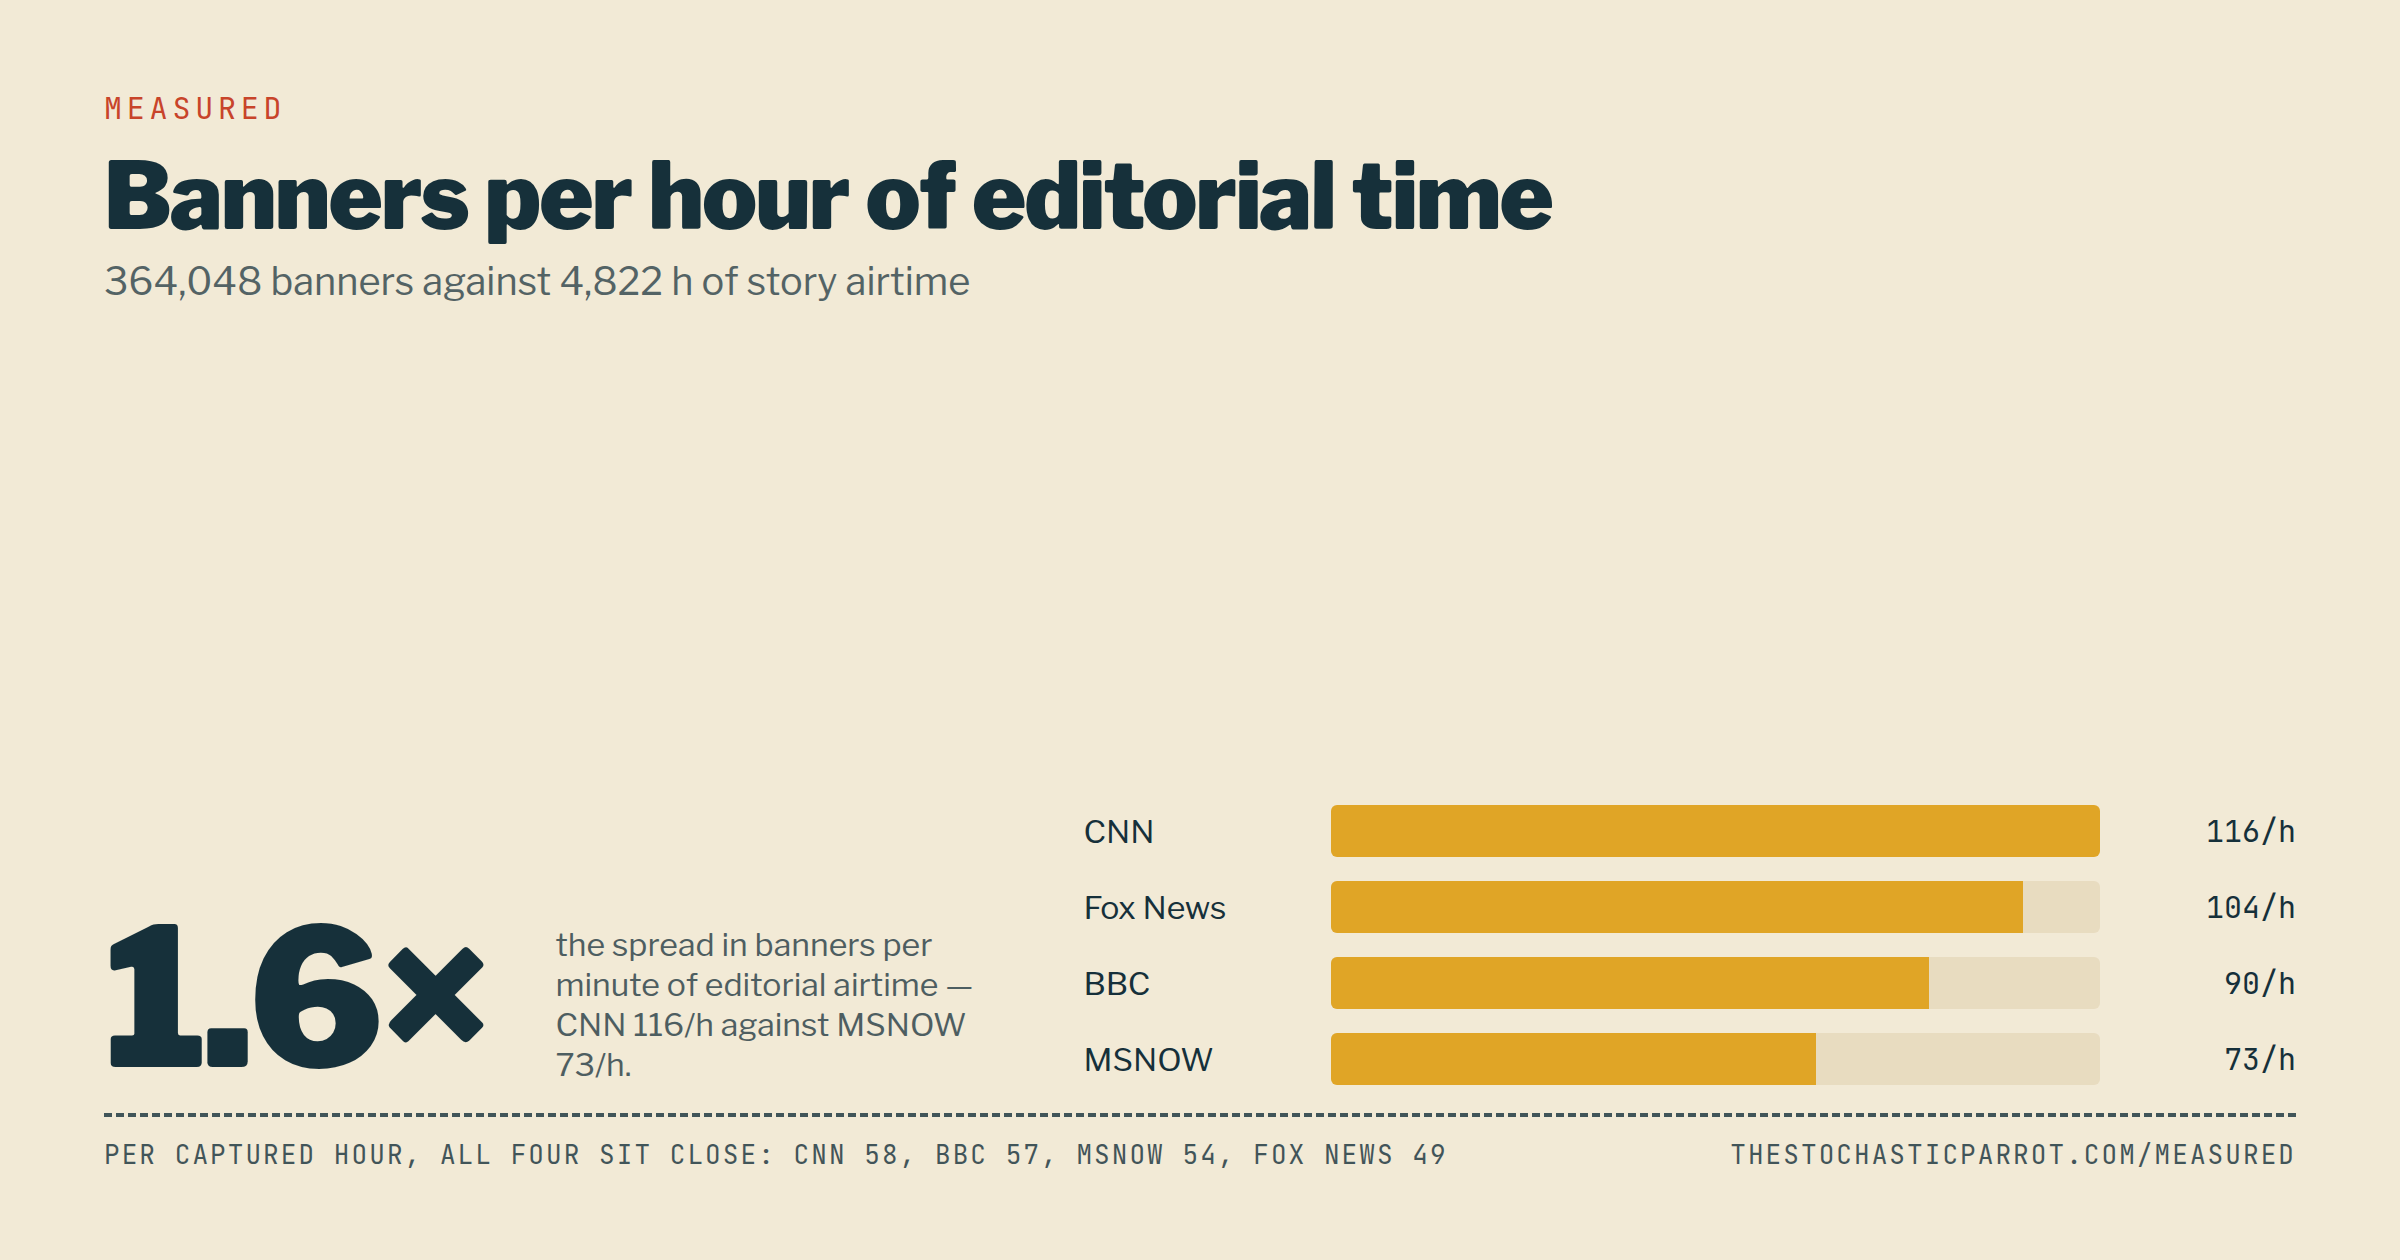
A banner is cheap to make and expensive to measure, so here is the measurement. Across 99 days the desk read 364,048 chyrons off five channels. Against 4,822 hours of story airtime, that is a branded lower third every 47 seconds of editorial content, with one channel running nearly twice as dense as another.
| Channel | Banners per hour of story airtime | Banners per hour of captured airtime |
|---|---|---|
| CNN | 116.0 | 57.6 |
| Fox News | 104.4 | 49.1 |
| BBC | 90.2 | 56.9 |
| MSNOW | 73.1 | 54.1 |
The two columns tell different stories, and the difference is the finding.
Per hour of whatever aired, all four channels sit within a narrow band — 49 to 58 banners an hour. On-screen text is close to a constant of the medium: something is almost always labelled. Per hour of story airtime, the spread opens to 1.6×: CNN puts 116 banners over every hour of editorial segment, MSNOW 73. The gap is not that MSNOW writes fewer banners. It is that MSNOW's segments are longer (see No. 2), and a long panel carries one banner across eight minutes where a rolling news hour would have put four different ones up.
So the chyron rate is a format artefact, not an editorial appetite. A channel that looks caption-dense may simply be cutting more often.
Two limits, both of which belong in the body rather than a footnote. First, 57% of these banners cannot be checked against the audio at all (No. 1), and OCR quality is not uniform across set designs — a channel with denser graphics may lose more banners to garble, which would lower its measured rate. Second, a banner that stays up for eight minutes is counted once: this measures banners aired, not seconds of screen time.
What this does not say. It does not rank the channels, and it does not claim that more banners means more editorialising. It says the rate is set by cutting rhythm, and that anyone comparing on-screen text across networks without normalising for segment length is measuring their own arithmetic.
Method. Source: chyrons (364,048 rows) against stories where kind='story' (4,822.5 hours of airtime) and sessions (8,741 sessions, captured hours). Window 2026-07-15 → 2026-10-23; recording stopped 2026-10-23. Figures pinned in data/measured/facts.json (banners); rerun with python -m parrot.measured.
How to check every number. Figures are generated by
python -m parrot.measured into data/measured/facts.json, each one
carrying the query that produced it. The recording window closed on 2026-10-23; the desk does
not add to it. Corrections are published against the facts file, not edited into the prose.